- 6 min read


An Academic Research Survey is a structured data collection tool used by researchers (students, scholars, or institutions) to gather information from a targeted population for scholarly purposes. It is a common method in quantitative, qualitative, or mixed-methods research to test hypotheses, explore trends, or validate theories.
Key Characteristics of Academic Research Surveys
- Purpose-Driven
- Designed to answer specific research questions or test hypotheses.
- Examples:
- “How does social media usage affect students’ attention spans?”
- “What barriers do women face in STEM careers?”
- Structured & Standardized
- Uses clear, unbiased questions (e.g., Likert scales, multiple-choice, open-ended).
- Follows ethical guidelines (informed consent, anonymity, IRB approval).
- Targeted Population
- Focuses on a defined group (e.g., university students, healthcare workers, specific demographics).
- Analyzable Data
- Produces data for statistical analysis (quantitative) or thematic coding (qualitative).
Types of Academic Research Surveys
| Type | Description | Example Questions |
| Descriptive | Captures characteristics of a population. | “What percentage of students use AI tools?” |
| Exploratory | Investigates little-understood phenomena. | “How do teachers perceive ChatGPT in grading?” |
| Causal | Tests cause-effect relationships (rare in surveys; experiments are better). | “Does mindfulness training reduce student stress?” |
Common Survey Formats
- Online Surveys (Google Forms, Qualtrics, SurveyMonkey)
- Pros: Cost-effective, wide reach, automated analysis.
- Cons: Risk of low response rates or biased samples.
- Paper-Based Surveys
- Used in fieldwork or for populations with limited internet access.
- Interviews (Structured or Semi-Structured)
- Qualitative depth but time-intensive.
Essential Components
- Informed Consent
- Participants must voluntarily agree (often via a checkbox).
- Demographic Questions
- Age, gender, education, etc. (for subgroup analysis).
- Core Research Questions
- Quantitative: Likert scales, rankings, multiple-choice.
- Qualitative: Open-ended text responses.
- Debriefing
- Explains the study’s purpose post-survey (ethical requirement).
Best Practices
- Avoid Leading Questions
- ❌ “Don’t you agree that AI is dangerous?”
- ✅ “What are the potential risks of AI?”
- Pilot-Test
- Run with 5–10 people to refine clarity and flow.
- Ensure Reliability/Validity
- Use established scales (e.g., Likert scales) for measurable constructs.
- Ethical Compliance
- Obtain IRB approval (for formal research), ensure anonymity, and allow opt-outs.
Example Use Cases
- Education Research
- “Impact of online learning on student engagement.”
- Psychology
- “Correlation between sleep quality and anxiety levels.”
- Market Research (Academic Context)
- “Adoption rates of renewable energy technologies in rural areas.”
Analysis & Tools
- Quantitative: SPSS, Excel, R, Python (Pandas).
- Qualitative: NVivo, Thematic Coding.
- Visualization: Tableau, Matplotlib, Seaborn.
Limitations
- Sampling Bias: If only certain groups respond.
- Self-Report Bias: Participants may misremember or give socially desirable answers.
Comprehensive Academic Research Survey Template
1. Survey Title & Introduction
Title: Clear and specific (e.g., “Perceptions of AI in Higher Education: A Student Survey”).
Introduction Text:
- Purpose: Explain the study’s goal (1–2 sentences).
- Confidentiality: Assure anonymity (e.g., “Responses are anonymized and used only for research”).
- Duration: Estimate time required (e.g., “5–7 minutes”).
- Contact Info: Provide researcher/institution email.
- Ethics Approval: Mention IRB/ethics board approval if applicable.
Example:
“This survey explores university students’ attitudes toward AI tools in academic work. Your responses are anonymous and will help improve educational practices. This study is approved by [Institution] Ethics Board (#12345). Contact: [email protected].”
2. Informed Consent (Mandatory)
Include a checkbox or “I agree” button for compliance. Example:
✅ “I understand the purpose of this study, and I voluntarily agree to participate. I know I may withdraw at any time.”
3. Demographic Questions
Customize based on your study population. Common options:
| Variable | Response Options |
| Age | 18–24, 25–34, 35–44, 45+ (or open-ended: “_____ years”) |
| Gender | Male, Female, Non-binary/Third Gender, Prefer not to say |
| Education | High School, Bachelor’s, Master’s, PhD |
| Field of Study | STEM, Social Sciences, Humanities, Other (specify) |
| Nationality | Open text box or predefined regions (e.g., North America, Europe) |
Pro Tip:
- Place demographics at the end if they’re not central to analysis (reduces dropout rates).
4. Core Survey Questions
A. Quantitative (Likert Scales)
Use for measuring attitudes, frequency, or agreement.
Example 1: 5-Point Likert Scale
“How strongly do you agree with this statement: ‘AI tools improve my learning efficiency.'”
1 (Strongly Disagree) – 5 (Strongly Agree)
Example 2: Frequency Scale
“How often do you use ChatGPT for academic tasks?”
[ ] Daily | [ ] Weekly | [ ] Monthly | [ ] Never
B. Qualitative (Open-Ended)
Use for exploratory insights.
Example:
“Describe one challenge you’ve faced when using AI for research.”
(Text box with 200-word limit)
C. Multiple Choice (Nominal Data)
Example:
“Which AI tool do you use most often?”
[ ] ChatGPT | [ ] Gemini | [ ] Copilot | [ ] Other: _____
5. Advanced Question Types
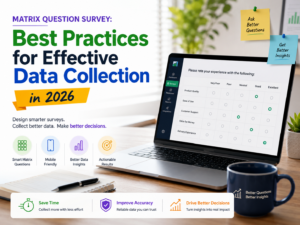
A. Matrix Questions
Efficient for related Likert-scale items (e.g., usability metrics).
| Statement | 1 (Poor) | 2 | 3 | 4 | 5 (Excellent) |
| “The interface is user-friendly.” | ⚪ | ⚪ | ⚪ | ⚪ | ⚪ |
| “The tool provides accurate results.” | ⚪ | ⚪ | ⚪ | ⚪ | ⚪ |
B. Ranking Questions
“Rank these AI concerns from 1 (most worrying) to 4 (least worrying):
[ ] Data privacy | [ ] Bias | [ ] Job displacement | [ ] Over-reliance
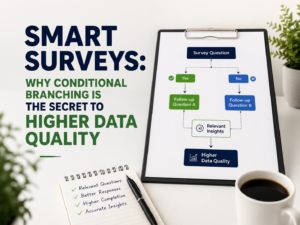
C. Filter Logic
Use skip logic (e.g., “If you answered ‘No,’ skip to Q10”) via tools like Qualtrics.
6. Post-Survey Section
- Debriefing: Share study goals (e.g., *”This research aims to…”).
- Contact Info: Repeat researcher email for follow-ups.
- Incentives (if any): e.g., “Enter a raffle for a $20 gift card!”
Best Practices for Academic Surveys
- Pilot Test: Run with 5–10 people to catch ambiguities.
- Avoid Bias:
- ❌ “Don’t you think AI is harmful?” (Leading)
- ✅ “What are the risks of AI in education?” (Neutral)
- Randomize Questions to reduce order effects.
- Mobile Optimization: 60% of surveys are taken on phones.
Tools for Distribution & Analysis
- Free: Google Forms, Microsoft Forms, LimeSurvey.
- Paid: Qualtrics, SurveyMonkey (advanced analytics).
- Analysis: SPSS (quantitative), NVivo (qualitative), or Python/R.
Need Further Customization?
- For Psychology Studies: Add validated scales (e.g., Likert-based questionnaires).
- For Education Research: Focus on learning outcomes, instructor roles.
- For STEM: Emphasize technical proficiency or tool usage.
Final Thought
Whether you’re a student, educator, or professional researcher, a well-designed academic survey can provide valuable, publishable insights. By following best practices in design, distribution, and analysis, you can ensure your study contributes meaningfully to your field.